§ Field Notes
The fade and the flip.
On the curious habit of paying for assets you've already chosen to own
MAY 09 2026 · 11 min read
Contents
- The setting
- The trade we are not going to take
- The dislocation, properly understood
- The first cycle
- The second cycle, in which the elevator goes back up
- A brief and necessary detour into fees
- The third cycle, in which the chart called for an audible
- The fourth cycle, in which the trend gave one last gasp
- What this is not
- What it is
There is a tidy little cottage industry in this corner of the market devoted to a trade that does not, when you carry it past the second decimal place, exist. The trade has a name. Funding rate arbitrage. The mechanics are advertised with a confidence that would not survive a graduate seminar but does survive a landing page, and the result is a steady supply of retail traders who arrive at decentralized perpetual exchanges believing they have stumbled onto a frictionless yield. They have not. What they have stumbled onto is a coordinate-system error dressed up as alpha, sold by aggregators paid by referral.
This is a journal entry, the first of what will become several, in which I would like to do something more useful than mock the aggregators. I would like to walk through what funding rate dislocations actually price, with the math worked out, on a real asset, in a window that closed a few hours ago. The arbitrage is a phantom. The directional consequence of the dislocation that produces the arbitrage signal is not. There is a trade there. It is not the one being sold. It is, as is so often the case, the one being given away.
The setting
The asset was VVV, a small-cap token in the AI-themed basket, listed as a perpetual on Hyperliquid among other places. The macroeconomic backdrop, if I may dignify the present moment with the term, is one in which capital is rotating into smaller alternative-coin names with a velocity that suggests the rotators have decided, collectively, that the major-cap rally is finished and the next leg has to come from somewhere. VVV had returned roughly fourteen percent in the prior twenty-four hours, with the late-session reading sitting at +14.42 percent over the rolling day. The chart was not subtle.
The funding rate at the top of the hour I am about to describe was +0.0683 percent. That is a per-hour figure, not annualized, and the distinction matters for reasons I will get to in a moment. On the short side of the trade was a venue called Lighter, where the same asset was funding at +0.0012 percent per hour. The headline spread between the two, on a screener somewhere on the internet, was being displayed as a four-figure annualized return on margin. Several four- figure annualized returns on margin, depending on the leverage multiplier the screener had quietly applied without telling anyone. This is the trade we are not going to take.
The trade we are not going to take
A delta-neutral position with $5,000 long on Lighter and $5,000 short on Hyperliquid would, at the next snapshot, collect funding income of approximately $3.36. The Hyperliquid short receives roughly $3.42 in funding, the Lighter long pays roughly $0.06, and the difference is the headline. To establish the position with market orders, the trader pays Hyperliquid’s taker fee twice, once on entry and once on exit. We will return to that fee schedule in a moment.
The arithmetic is what it is. The first snapshot delivers $3.36 in funding income against approximately $4.32 in transaction costs on the Hyperliquid leg alone. Lighter, mercifully, does not charge fees on perpetual swaps, so the other leg is free to open and close. Even with one of the two legs costing zero, the position is underwater on the first cycle. To break even, the spread must persist across multiple snapshots, the position must be held through them without margin calls, and the two venues must not, in the meantime, diverge in any of the seventeen ways that two venues can diverge in the time it takes to rebalance a delta-neutral perp position.
This is the trade that the screeners advertise. The advertised return-on-margin is the cumulative spread, multiplied by leverage, projected over a year, with no discount for the fee burden, no allowance for snapshot timing mismatches between venues operating on different funding clocks, and no acknowledgment that the displayed spread is a snapshot of right-now and the realized spread is whatever the rate happens to be when the next print occurs. The headline number is computed. It is not earned.
I will say something nice about this trade before I move on, because it is not, in fact, a fraud. At institutional size, with maker rebates in lieu of taker fees, with execution sophisticated enough to manage inter-venue basis risk, with the capital base to ride out the inevitable adverse cycles, the trade exists. It is unglamorous, it is low-margin, and it is essentially a tax on the asymmetric flows the screeners are sending toward it. None of which is the trade being pitched to the man with $5,000 and a phone.
The dislocation, properly understood
A funding rate at +0.0683 percent per hour is not arbitrage bait. It is positioning information. The longs on Hyperliquid have agreed, collectively, to pay shorts roughly seven basis points an hour for the privilege of remaining long. They have agreed to this because they are convinced enough of the trend that the funding cost is, to them, the second most important number on the page. The first is the direction.
Crowded positioning is interesting in the way that crowded elevators are interesting. The crowd has chosen its destination, but the mechanism that gets the elevator there is sensitive to the weight distribution within it. At some point one of the passengers reads the small print on the certificate of inspection, decides that sixty-eight basis points an hour is more than they care to pay for the ride, and steps off. If enough passengers step off in the same window, the elevator briefly drops.
The window is the seven minutes before the funding snapshot fires. The mechanism is the closing flow of crowded longs who have decided to skip this particular payment. They will reopen after the snapshot prints, once the bill has been settled and the meter has reset. In the meantime, their selling pushes the asset down. The chart records this. It is a forced move, mechanical in origin, predictable in direction, and visible to anyone who is watching at the right time.
This is the dislocation that the cross-venue spread is also measuring, indirectly, in its annualized headline. The two are expressions of the same thing. The first expression is what the screener sells you. The second is what actually trades.
The first cycle
Seven minutes before the top of the hour I went short with $3,333 of collateral, three times leverage, $10,000 of notional. Market order in. The selling I had been waiting for showed up roughly on schedule, and the asset proceeded to print a 1.57 percent decline over the subsequent six minutes. I covered shortly after the snapshot, when the first green candles appeared and the panic-selling cohort had finished its business.
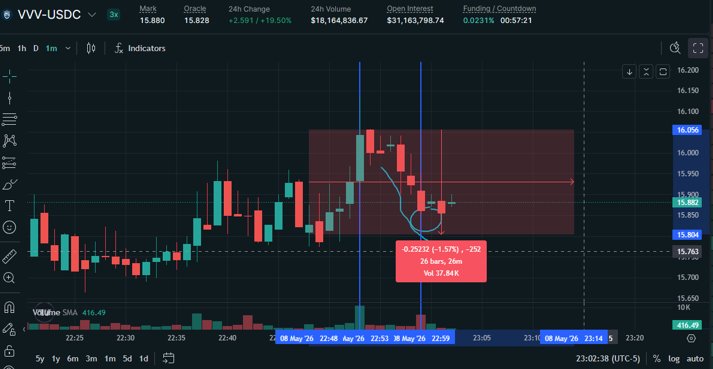
The math, which I will be tediously careful about because the imprecision in the wider literature is part of what this site exists to correct: a 1 percent capture is conservative against the actual 1.57 percent move and accounts for both my late entry and my early exit, neither of which I am proud of and both of which are typical of discretionary execution under time pressure. Gross on $10,000 notional: $100. Round-trip taker fees on Hyperliquid: $8.64. Net: $91.36. The collateral, which had begun the evening at $3,333, was now $3,424.
A reader who would like to extrapolate from this to a daily, weekly, or annualized return is welcome to do so privately. I will not participate in the exercise. The trade described in this paragraph took roughly twelve minutes from entry to exit. The trade described in the next several paragraphs will take longer, will be smaller, and will not annualize.
The second cycle, in which the elevator goes back up
The same crowded longs who had stepped off the elevator before the snapshot now reboarded. New passengers, observing what looked like a discount on a strong-trending asset, joined them. The asset bounced. The bounce was, in market-microstructure terms, the unwinding of a mechanical move that had no fundamental basis to begin with. The buyers who had triggered the dump returned. The price action followed.
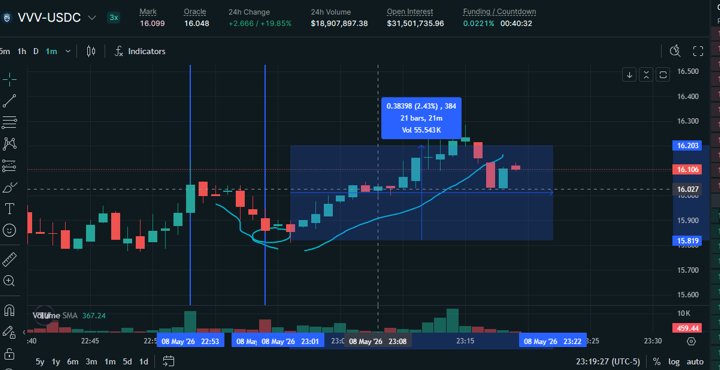
I flipped to long with the now-$3,424 of collateral, three times leverage, $10,272 of notional. Caught roughly 1.76 percent of the 2.43 percent move, again being conservative about my entry and exit relative to the theoretical maximum. Round-trip taker fees on $10,272: $8.87. Net: $171.92. Collateral: $3,596.
Two trades, twenty-something minutes elapsed, $263 net on a base of $3,333. The reader’s mental arithmetic will already have produced a percentage figure. I would prefer the reader hold off on the percentage figure until they have read the section titled “What this is not,” which is several sections below.
A brief and necessary detour into fees
It is worth pausing here to look at exactly what the venue is charging, because the fee schedule is what separates the cross-venue arbitrage trade (which loses money at retail size) from the directional fade (which does not).
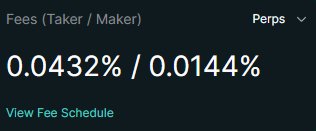
The fee burden on the cross-venue arb is fatal because the position must pay these fees while collecting only a few dollars of funding income per snapshot. The fee burden on the directional fade is manageable because the position is paying these fees while capturing moves measured in whole percentage points, not basis points. Same fees, very different proportions.
The third cycle, in which the chart called for an audible
The next snapshot was an hour out. The funding rate had compressed somewhat from the prior cycle. The chart, on the five-minute timeframe, was producing a topping head and shoulders structure. The volume on the most recent push higher was lighter than on the prior leg. It was now late evening, late on a Friday, late in a fourteen- percent run. The conditions for a clean post-snapshot continuation were measurably weaker than they had been an hour earlier.
I went short again at the seven-minute mark. This time, rather than covering at the snapshot and flipping to the bounce, I held the short through the print and for two additional minutes after. The read was that the post-snapshot bounce, if it materialized at all, would fail to extend. This proved correct. The asset declined 2.58 percent peak to trough across the window, and I captured 2.1 percent of it.
The math here is more involved because I have to factor in the spread on the order book, which had widened with the late-session liquidity drain, and the funding payment I received as a short across the snapshot, which nudged the math in my favor. Spread costs on entry and exit: roughly 10.2 basis points combined. Funding received as the holder of the short across the print: roughly 2 basis points back, which reduced the spread cost to a net 8.2 basis points. Round-trip taker fees: 8.6 basis points more. Captured move, all in: roughly 194 basis points on $10,788 of notional. Net: $209. Collateral: $3,805.
The trade in this cycle was different in kind from the trade in the prior cycle. Cycle two’s profit came from two separate trades, each capturing one half of the snapshot mechanic. This cycle’s profit came from one trade, capturing both halves, because the chart was telling me the second half was unlikely to develop. The funding rate told me the dump was coming. The funding rate did not tell me whether to flip to the bounce. The chart did.
This is, I think, the most important sentence in this article. The funding rate is a setup. It is not a strategy. The strategy is what the discretionary trader does with the setup, and the strategy varies by regime, by chart, by hour, by asset. The funding rate scanner can identify the setup. The scanner cannot identify the strategy.
The fourth cycle, in which the trend gave one last gasp
A bounce did materialize on the next cycle, weaker than the second cycle’s. I flipped to long once it was clear the trend wanted one more push, capturing about 0.64 percent of a 2.05 percent move, and exited when momentum faded.
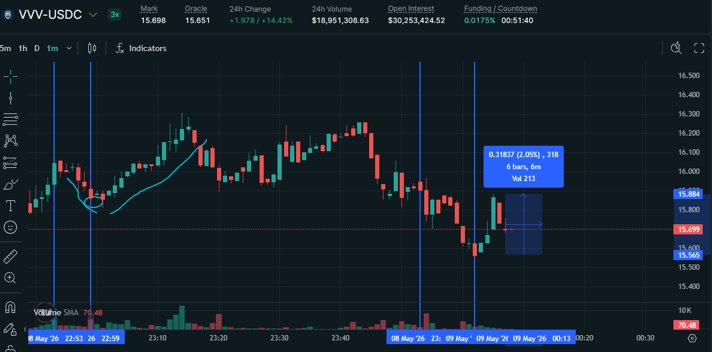
Spread costs on this trade were wider than earlier in the evening, around 13 basis points combined on entry and exit. Round-trip taker fees: 8.6 basis points more. Total drag: 21.6 basis points. Net captured move: about 42 basis points on $11,415 of notional. Net: $48. Collateral: $3,853.
Four trades, three hours, $520 net on a $3,333 base. I will allow myself one moment of vulgarity. The percentage figure is 15.6.
What this is not
What it is not, first, is repeatable on demand. VVV happened to be in a clean trending regime tonight. The funding rate happened to be elevated. I happened to be at the screen during the relevant windows. The chart structure in cycle three happened to be readable enough that I could make the call to hold through the snapshot rather than flip. None of these conditions is guaranteed in the next session, the next week, or the next month. A trader who arrives at this article expecting to extract 15.6 percent in three hours on a regular basis will discover, in fairly short order, that the strategy is regime-dependent in ways that the strategy’s enthusiasts do not typically advertise.
What it is not, second, is suitable for the trader who has not yet internalized the mechanics. The fade and the flip require, at minimum: an instinct for trend versus chop, the willingness to enter in a direction that feels wrong because the chart is moving against you, the discipline to exit when the snapshot fires rather than holding for more, and the tactical awareness to recognize when the bounce will fail and to deviate from the default plan accordingly. These are not skills the funding rate scanner will give you. These are skills you will develop, if you develop them at all, by losing money on early attempts at this trade and learning what the losses have in common.
What it is not, third, is the trade I just walked through, repeated mechanically. The articles in this thread will, over time, document attempts at this trade across regimes, across assets, including the ones where the trade fails. The point of the journal is not to flex the wins. The point is to build, across enough cycles, a body of evidence about when the strategy works and when it does not. A single evening’s trade is not a strategy. It is an observation.
What it is
It is the trade that the cross-venue funding arbitrage screener is, without realizing it, pointing at. The screener is showing you a spread number that, taken at face value, is a mirage. The spread number is also, taken as a positioning signal, an indication of where the crowded longs are paying to remain crowded. The dislocation that produces the spread is the dislocation that produces the directional move into and out of the snapshot. The screener does not know how to trade the second thing. The discretionary trader, with practice, can.
The funding rate arbitrage industry is welcome to its referral revenue. I would prefer to write about what is actually trading, in windows that close a few hours before I publish, with the math worked out and the regime acknowledged.
This is the first entry in what will become a journal of these windows. The next will arrive when the next interesting one does.